Where do families live? Which neighborhoods are aging? How good are the public transport connections? The "Cockpit Public Planning" program from Lucerne University of Applied Sciences and Arts visualizes data as clear maps and thus supports authorities in community and neighbourhood development.
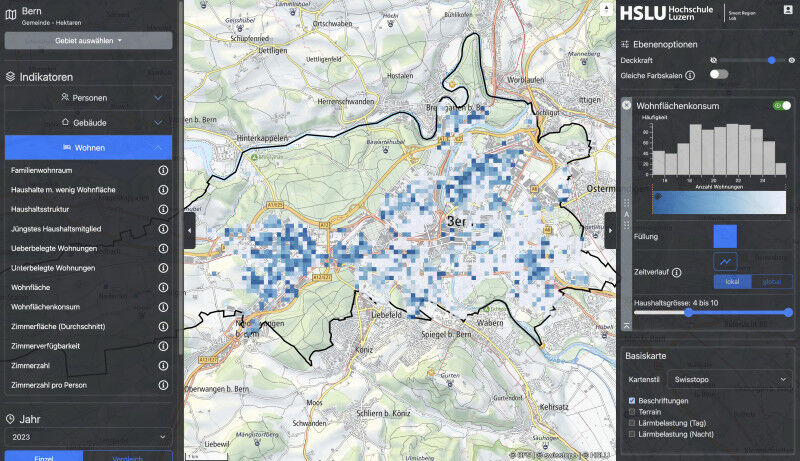
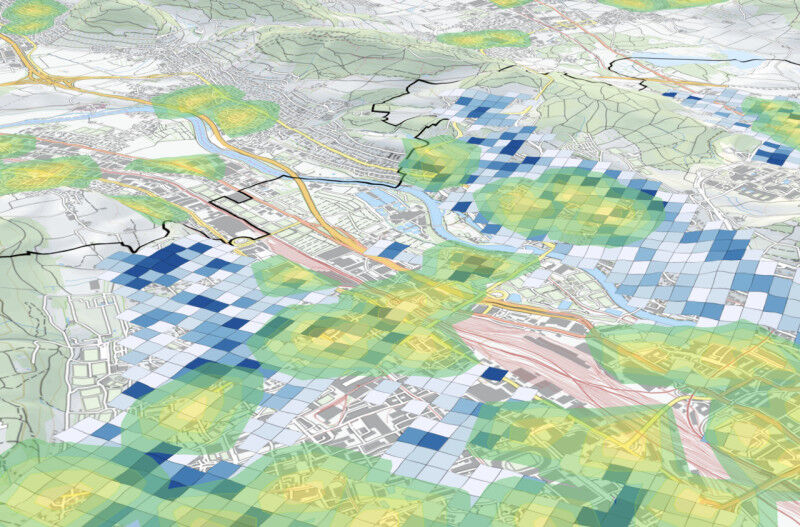
Housing shortage, ageing, traffic planning: municipalities and cities are facing a variety of challenges. With the "Cockpit Public Planning", the Lucerne University of Applied Sciences and Arts has developed an application that interactively displays nationwide data from the Federal Statistical Office on population, households, buildings, housing types and residential mobility on digital maps. The "Cockpit" visualizes this data at various spatial levels - from a canton-wide overview of individual districts to a detailed representation in 100-metre grids. The tool shows, for example, how the age structure is developing, which types of housing are predominant and what the public transport connections are like.
"We can see, for example, where many older people live in apartments that are too large or where families need more living space," explains Ivo Willimann, project manager of the Cockpit at Lucerne University of Applied Sciences and Arts. It also shows how far away the nearest shopping facilities are for residents. The possible applications are extremely diverse, as the various data can be combined both spatially and temporally.
Sarnen municipality already using Cockpit
Municipalities continuously record data in the population register and in the building and housing register. Manuel Christen, research assistant in the Smart Region Lab at Lucerne University of Applied Sciences and Arts, says: "The Cockpit refines this data and makes it usable for specific planning issues." The spatial representation supports fact-based collaboration across specialist and jurisdictional boundaries. This gives politicians and administrators a clear decision-making basis for their social, municipal and infrastructure planning. "If everyone is looking at the same maps, more constructive discussions about the future of the municipality can take place."
Several municipalities are already using the tool successfully. For example, Sarnen, the capital of Obwalden with around 11,000 inhabitants: the Cockpit Public Planning helps municipalities like Sarnen to better understand spatial and social developments in housing and settlement planning and to react strategically to them. "Especially in the context of demographic change and changing housing and mobility needs, the tool provides valuable analyses of population structure, household development and housing utilization," says Simon Unternährer, Project Manager for Spatial Development, Mobility and Environment at the municipality of Sarnen. The cockpit creates a fact-based and clear basis for dialog with property owners, experts and political decision-makers.
Making complex data usable
The public planning cockpit is the result of research and consultancy work carried out by Lucerne University of Applied Sciences and Arts in the field of regional economics and was created as part of the Smart Region Lab. The aim is to develop tailor-made, interactive visualization solutions that make complex data understandable and usable. ’Interactive data visualizations are the best communication medium between man and machine,’ says Halldór Janetzko, Head of the Smart Region Lab. They make connections visible and thus promote data-based decisions.
Access with an annual license
The ’Cockpit Public Planning’ is a project of the Smart Region Lab at Lucerne University of Applied Sciences and Arts and supports cities, municipalities and regions in dealing with their social and spatial planning issues in a well-founded and future-oriented manner.
With a license, municipalities receive online access to the Cockpit Public Planning. The price of an annual license depends on the size of the population. For example, it currently costs CHF 2,250 for a municipality with 5,000 people and CHF 3,500 for a municipality with 30,000 people. The Lucerne University of Applied Sciences and Arts provides support with the installation. A non-binding offer can be requested on the Cockpit website.
You can see how the cockpit works in these three videos:
- What is the Public Planning Cockpit?
- When does the Public Planning Cockpit provide added value for municipalities?
- How can the Public Planning Cockpit be used in practice?