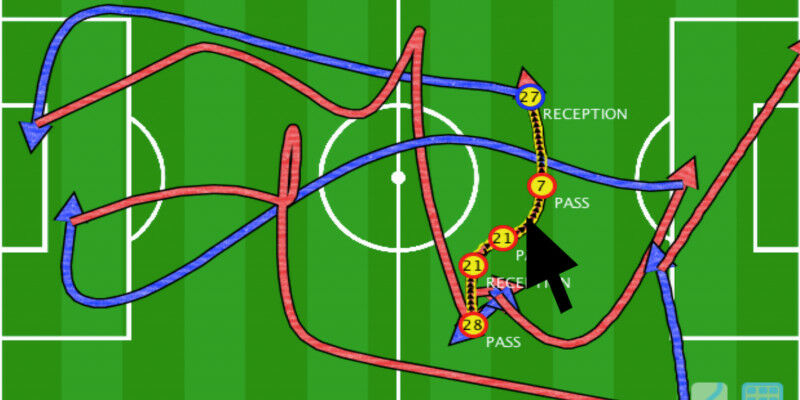
The movement data of 22 persons over 90 minutes summarised into a number of main patterns: This is a meaningful visualisation of movement data in football.
By Birgit Baustädter Tobias Schreck and his team are developing tools for strategy-loving fans and professionals with the University of Konstanz: They visualise and analyse movement data from football games. A ball of wool. That's what the chaotic structure looks like on Professor Tobias Schreck's computer screen at the Institute of Computer Graphics and Knowledge Visualisation at TU Graz. A bi-coloured ball of wool to be precise. It is not easy to imagine that tactics, moves and the performance of individual football players can be derived from this confusing image. But they can. Once Tobias Schreck, his team at TU Graz and his cooperation partners at the University of Konstanz have acquired all the data, understanding complex interrelationships in huge amounts of movement data will be a lot easier.
TO READ THIS ARTICLE, CREATE YOUR ACCOUNT
And extend your reading, free of charge and with no commitment.