© Martin Van Damme and Lieven Clarisse / ULB Map of atmospheric ammonia fluxes based on 9 years of IASI data. It shows 242 hot spots, surrounded by black circles, and 178 wider emission zones, framed by white rectangles.
Paris, December 5, 2018 Researchers from the CNRS
1 and the Université Libre de Bruxelles (ULB) have prepared the first global map of the distribution of atmospheric ammonia (NH
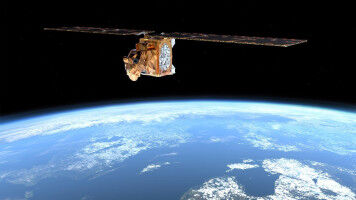
3 ) by analyzing measurements taken by satellites between 2008 and 2016. The IASI interferometer developed by the CNES allowed them to catalog more than 200 ammonia sources, two-thirds of which had never been identified before. These sources are essentially sites of intensive livestock production and industrial activity. The team's findings are published in Nature (December 5). For the last twelve years, the IASI interferometer on board three successive Metop2 satellites have been providing scientists with global data on various atmospheric components, including ammonia. Atmospheric ammonia merits particular attention because it breaks down into fine ammonium salt particles that degrade the quality of the air we breathe. Yet the processes regulating concentrations of this gas are still poorly understood, especially on the local scale.
TO READ THIS ARTICLE, CREATE YOUR ACCOUNT
And extend your reading, free of charge and with no commitment.
Your Benefits
- Access to all content
- Receive newsmails for news and jobs
- Post ads